
Full disclosure: Business Intelligence (BI) isn’t software. It’s a new way of looking at your camp.
We all know what happened at camp this summer—we lived it! From registration launches to camp fairs to staff training, every moment was packed. Now the last campers have gone home, the cabins are quiet, and the soccer balls are packed away.
It’s tempting to take a breath and dive straight into planning for next year. But before rushing ahead, this is the perfect time to pause and ask:
What can we learn from this summer?
Did we meet our organizational goals?
If not, where did things go off track?
Beyond stories and memories, camps are sitting on a treasure trove of data that can help answer those questions. That’s where Business Intelligence comes in.
““Not everything that can be counted counts,
and not everything that counts can be counted.””
What Is Business Intelligence (for Camps)?
The phrase “Business Intelligence” might sound like something only Fortune 500 companies worry about. But really, BI just means:
Collecting information → Analyzing it → Using it to make smarter decisions.
Every camp can do this even if you don’t think of yourself as a “tech person.”
IBM defines BI as:
“A set of technological processes for collecting, managing, and analyzing organizational data to yield insights that inform business strategies and operations.”
For camps, BI means looking at the data you already have, such as registration numbers, surveys, schedules, budgets, and using it to see what’s working, what’s not, and where you can improve for next summer.
The BI Process: Collect → Analyze → Gain Insights
1. Collect Data
You probably already gather more data than you realize. It’s just scattered across different systems and files. A few examples:
Registration Software: How many first-time families vs. second-year returners?
Surveys: What did parents say about their camper’s experience?
Website Analytics: What sites, keywords, or phrases are referring traffic to your site?
Hiring Records: Where did the staff you thought were “awesome” come from?
Scheduling Software: What were campers’ top activity preferences?
First Aid Logs: What injuries happened, and are some preventable?
When pulled together, these data points give you a complete picture of how well you’re meeting your goals.
2. Analyze the Data
Once you have the data, the next step is asking questions. This is where Key Performance Indicators (KPIs) come in. KPIs are measurable values that help you track your progress towards specific goals. For example, you may have KPIs related to these topics:
Camper Retention & Registration
KPI Question: Where are we losing the most returners?
How to Measure: Compare registration data year-over-year by grade and by returning/new status. For example, if the biggest drop-off happens after 6th grade, you’ve identified a critical transition point.
Why It Matters: Knowing when families are most likely to leave your program helps you make changes that entice campers to continue attending. Make adjustments to programming, communication, or alumni-style offerings to keep them engaged longer.
Activity Popularity & Preferences
KPI Question: Is the popularity of an activity consistent annually, or are other factors, such as a tight-knit group of friends or a popular staff member, influencing its appeal?
How to Measure: Tally camper activity preference rankings (e.g., 30 campers chose archery, but only 10 ranked it as their first choice).
Why It Matters: Reveals whether activities are genuinely popular or just temporarily boosted by outside influences, helping camps plan offerings that truly align with camper interests.
Staff Allocations & Utilization
KPI Question: Did we staff efficiently based on actual camper participation?
How to Measure: Compare staff schedules with camper participation. For example, did you really need five soccer coaches, or would three have covered camper demand?
Why It Matters: Having the right number of staff prevents burnout, controls costs, and ensures program balance.
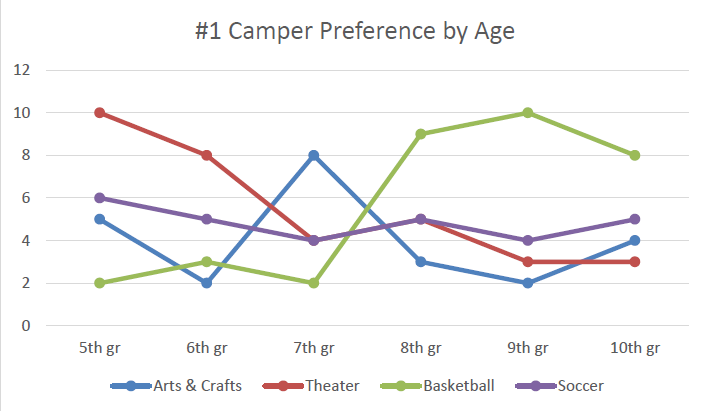
When analyzing information, consider creating visual aids such as graphs, charts, and dashboards. Visuals are especially helpful during staff debrief meetings or planning sessions, where a quick snapshot of the data can spark discussion and ideas for improvement. For example, you might create charts using camper preference data to determine which activities are most popular overall and by age group.

3. Gain Insights
Here’s where the magic happens by turning data into action.
Programming: Losing campers after 6th grade? Ask parents why. Parents love giving feedback!
Registration: Families from a nearby town showed interest but didn’t sign up? Maybe it’s time to offer bus services to that area or attend local camp fairs.
Scheduling: Older campers rating activities poorly? Design activity tracks just for them that may be a departure from your typical schedule.
These are the kinds of insights that lead to smarter planning and smoother summers.
Why It Matters
Business Intelligence isn’t just for large corporations. Camps benefit just as much from looking closely at their data whether it’s registration trends, staff return rates, or activity popularity.
The best part? You’re already collecting much of this information. You just need to pause, connect the dots, and ask the right questions.
So before next summer sneaks up on you, take time to reflect. Your camp’s story isn’t just told in memories—it’s also written in the data.
Ready to make smarter decisions for your camp? While Business Intelligence might sound complicated, it starts with having clear, reliable data to work from. Camptivities helps camps organize schedules and activities in a way that makes it easy to see trends and make improvements year after year.
Camptivities logo
Contact us today to see how scheduling software can give you the foundation for better insights.


